

Released 17th September 2026Detection floors are higher on chatty rules, so bursty but ordinary traffic is less likely to page you. Notification settings now let you batch non-critical alerts into a digest, and hourly and daily delivery caps are honored when they are set.
Changes
Notifications
- Organization delivery policy includes an alert digest: turn it on to batch non-critical incidents and choose the digest interval.
- Hourly and daily notification rate limits are applied when those settings are present, so channels stop flooding after the cap.
Detections
- Noisy detectors (including WAF rule bursts and overlapping ML emits) fire less often on the same traffic, so the incident list stays closer to real attacks.
Released 3rd September 2026Cloudflare top-path rankings now use the same minute window as the rest of the analytics page, so a one-hour or rolling three-day view no longer expands or shrinks to UTC calendar days. Incomplete log searches no longer show a Load More control that cannot continue. When one dataset times out, the activity graph still plots the datasets that succeeded and warns that the volume is incomplete.
Fixes
Analytics
- Top-path charts rank traffic inside the selected range instead of rewriting it onto whole UTC days.
Logs
- When one dataset times out, the logs table no longer offers Load More without a resumable cursor.
- The activity graph keeps partial histogram buckets and shows a timeout warning instead of hiding the chart.
DashboardLogsIncidentsAnalyticsFabric
Logs, incidents, fabric, and analytics recover on the production dashboard
Released 27th August 2026Production logs, incidents, fabric, and Cloudflare analytics recover after the Tinybird cutover. Long log ranges stay usable, HTTP rows can show FRS scores, incidents persist across analysis workers, and analytics panels no longer fail closed when a secondary chart times out.
Fixes
Logs
- Seven-day and other long windows no longer fail the whole page when one dataset times out or refuses the range.
- The activity graph plots Tinybird timestamps instead of staying flat at zero while the table has rows.
- HTTP FRS lookups wait longer for scores so recent requests are less likely to stay in PEND.
Incidents
- New incidents are saved to PlanetScale even when notification delivery is disabled, and workers reuse the same incident across replicas.
Analytics and fabric
- Cloudflare analytics still loads HTTP traffic when cache, security, or top-path charts fail.
- Rolling 3-day top-path windows align to UTC days so those charts stay valid.
- Fabric graph queries get a longer Tinybird timeout so large HTTP assets can return edges.
Released 26th August 2026Flarehawk Risk Score on logs now uses the Cloudflare bot score whenever that score is present, even if the score-source field is missing. HTTP and WAF events that share a Ray ID also merge again after the Tinybird cutover, and the numeric score now attaches to those rows in the logs table.
Fixes
Logs
- Request risk scores ground against Cloudflare’s bot score on rows that omit the bot-score source, so likely-human traffic no longer stays inflated.
- HTTP and WAF events for the same Ray ID merge on the logs page so FRS and WAF details sit on one row.
- Request risk scores now appear on matching HTTP and WAF log rows when Tinybird event timestamps differ from the FRS lookup, including Fastly HTTP/WAF views.
Released 25th August 2026Dashboard analytics, logs, fabric graphs, and provider panels now query Tinybird only. Incidents and alerts continue to load from PlanetScale. There is no ClickHouse fallback when a panel is empty.
Changes
Analytics and logs
- HTTP, WAF, cache, security, device, geographic, and top-path panels load from Tinybird contracts.
- Microsoft, Okta, and Zero Trust event views load from Tinybird event search.
- Connection health uses PlanetScale ingest receipts for recent delivery, not frozen batch tables.
Released 23rd August 2026Cloudflare connections that need authorization now guide administrators through Cloudflare sign-in first, restoring automatically refreshed access without asking them to create a long-lived API token.
Improvements
Cloudflare connections
- A prominent reconnect banner makes the blocked connection state and recommended Cloudflare sign-in action clear.
- API-token setup remains available as a secondary fallback when OAuth is unavailable.
- The provider tools disclosure is borderless and easier to scan when collapsed or expanded.
Released 22nd August 2026Returning users can keep moving through email-first sign-in when the account check is briefly unavailable. Analytics pages also fit smaller screens more cleanly, with a stacked dashboard picker and controls that stay within view.
Fixes
Sign-in
- After you submit your email, a brief account-check interruption now continues to the password step instead of showing an error or sending an existing user to sign up.
Analytics on mobile
- Provider groups stack in a single collapsible column on smaller screens instead of wrapping into uneven columns.
- Filters, time-range presets, the custom date picker, and loading panels stay within the screen on phones.
Released 21st August 2026IP lookups now include IPInfo Places when the Max lookup maps the address to a known venue, such as an airport, hotel, or campus network. Intel shows the place name, category, and Wi-Fi SSID next to geolocation so you can tell a traveler on airport Wi-Fi from a generic city pin.
Improvements
Intel lookup
- IP Info cards show venue name, category, and SSID when Places has a match.
- Maps use the venue coordinates when city-level geo is missing.
- Analysis enrichment uses the same Places data so alert explanations can name the venue.
Released 20th August 2026Logs now use a phone-friendly stacked view that keeps the most useful event context readable without a desktop-width table.
Improvements
Logs on mobile
- Each event summarizes its time, severity, location, action, message, source, and asset without horizontal scrolling.
- Expanded details wrap long values and keep investigation controls within the screen.
- Filters and time-range controls fit smaller screens more cleanly.
Released 19th August 2026Identity sign-in now uses the latest Better Auth 1.7 account model. Existing SCIM provisioning tokens cannot be migrated. Microsoft directory users are identified by their stable directory id. MCP clients that reconnect once keep using the same Flarehawk tools.
Changes
SCIM provisioning
- Generate a new SCIM token for each SSO provider and paste it into your identity provider. Previous tokens stop working after this release.
- Re-run a full user and group sync after the new token is in place so roles and membership stay current.
Microsoft sign-in
- Returning Microsoft accounts now match on the directory user id (
oid) instead of the app-specific subject. If Microsoft sign-in creates a second Flarehawk user, contact support to merge the accounts.
MCP
- If your MCP host asks you to reconnect after this release, re-authorize once. Existing tools and org-scoped access continue to work.
Released 19th August 2026When sign-in or sign-up shows a maintenance or outage banner, a slow ring now pulses from that banner so the status stays visible while you use the form.
Improvements
Sign-in and sign-up
- A faint ring in the banner color expands from the status message: blue for maintenance, yellow for degraded, orange for partial outage, and red for a major outage.
- The banner itself stays a solid fill so the message stays readable.
Released 18th August 2026Signing up no longer asks you to pick a plan before you can connect Cloudflare. New workspaces start on Free automatically. After you connect a provider, you can stay on Free or choose a paid plan. The dashboard no longer hosts a pricing page — compare plans on flarehawk.com.
Improvements
Signup
- After you create a workspace and invite your team (optional), you connect services in onboarding.
- Connect at least one provider, then choose Continue to plan. You can add more sources later.
- Once you continue, you choose a paid plan or stay on Free for now.
- If we recognize your email domain, that domain is the workspace identity. Use Use a different name only if you want to type something else.
Sign-in and onboarding
- Sign-up and the first workspace step are easier to read in light mode.
- Sign-in and sign-up issues show in the form instead of a corner toast.
- After you confirm your email, the waiting page updates and sends you to sign in.
- Connecting a source during onboarding no longer fails with a 500 page.
- The connect step no longer tells you that you are on Free before you pick a provider.
- On a phone, providers show as a two-column grid of logos and names. Linked providers are marked connected, and you stay on that grid until you continue to your plan.
Pricing
- Plan details live on the public pricing page. Bookmarks to the old dashboard pricing URL redirect there.
Released 16th August 2026Overview, Home, and Incidents now show live event totals instead of an unavailable banner with empty KPIs.
Fixes
Dashboard overview
- Event counts for the last 24 hours load from live ingest receipts, so the page no longer fails closed with dashes and “Latest ingest Never”.
- Sidebar event totals use that same ingest source, with cacheable time windows, instead of a slower scan that could starve the dashboard.
Released 16th August 2026Signing in with SAML from an identity provider such as Cloudflare Access now completes instead of showing a browser HTTP 500 page.
Fixes
SAML SSO
- Identity-provider logins that post back to Flarehawk no longer fail when the sign-in state cookie is missing on that cross-site request.
- If SAML sign-in still cannot complete, you are returned to the sign-in page with a clear error instead of a blank failure page.
Released 9th August 2026Flarehawk MCP now supports the 2026-07-28 Model Context Protocol revision while keeping compatibility with existing clients.
Improvements
MCP
- Modern MCP clients can talk to Flarehawk without a session handshake — each request is self-describing and works behind ordinary load balancing.
- Existing MCP clients that still use the previous initialize flow continue to work.
- If your MCP host prompts you to reconnect after this release, re-authorize once and continue using the same Flarehawk tools.
Released 4th August 2026Flarehawk API keys now support normal integration traffic without an unintended daily cutoff.
Fixes
API keys
- Valid API-key requests no longer begin failing after ten requests in a 24-hour period.
- Existing API keys recover automatically; you do not need to rotate or recreate them.
Released 1st August 2026Creating a workspace and joining an existing team now recover cleanly from two edge cases that could block onboarding.
Fixes
Organization setup
- Creating an organization no longer gets stuck on an endless loading state when account checks and workspace creation overlap.
- If the organization-creation request takes too long, it now stops with a clear retry message instead of continuing to spin.
Team invitations
- An accepted invitation that did not finish adding you to the team is offered again while it has not expired, so you can complete the join without contacting support. Expired invitations still need an admin to send a new one.
- When someone is removed from a team, invitations from their previous membership are retired so the recovery flow does not offer them again.
Released 30th July 2026Incident Detect now surfaces related traffic more reliably, and investigation summaries are labeled as Vigil analysis.
Fixes
Incident raw logs
- Detect samples both HTTP and WAF evidence when an incident spans those datasets, instead of returning an empty window when only one side is hot.
- If a top IP or path filter finds no rows, Detect falls back to the incident time window so you still see matching traffic.
Improvements
Vigil analysis
- Investigation summaries and failure messages now say Vigil analysis instead of AI analysis.
Released 30th July 2026Zscaler connections can now optionally link Zidentity OneAPI credentials so Flarehawk can remediate threats in ZIA — without changing the push-based Cloud NSS / LSS ingest path.
Improvements
Zscaler OneAPI + remediation
- Paste vanity domain, API client ID, and client secret on a Zscaler connection (client credentials — no browser OAuth redirect).
- Apply and roll back block URL (ZIA denylist) and block IP (destination group + firewall rule) response actions from incidents.
- Ingest-only connections still work with Cloud NSS / LSS alone; OneAPI fields are optional.
Released 29th July 2026Incidents and Vigil response guidance now stay bound to the provider and assets that actually contributed the security evidence.
Improvements
Provider-safe investigations
- Google Workspace audit and identity activity can no longer be presented as Cloudflare rate limiting.
- A single detector cannot elevate an incident beyond the severity of its strongest alert; critical escalation now requires critical evidence or corroboration from distinct detectors.
- Vigil separates evidence belonging to the selected incident from broader organization context, and risk-ranked incident results state their provider and detector diversity.
- Response actions name their provider and target, distinguish live from manual steps, and never offer rollback for irreversible session revocation or customer-owned state.
- Google Workspace live sign-out uses a separate administrator opt-in and remains approval-only.
- Akamai incidents receive property-specific manual Network List response steps; Flarehawk does not activate a list revision that could include an unreviewed concurrent edit.
Released 29th July 2026You can now connect Zscaler Zero Trust Exchange so ZIA Internet Access network telemetry (web, firewall, DNS, Client Connector tunnels) and ZPA Private Access user activity stream into Flarehawk.
Improvements
Zscaler Zero Trust + network
- Create a Zscaler connection to receive HTTPS destination URLs and an ingest token — there is no Zscaler OAuth; configure ZIA Cloud NSS feeds and optional ZPA LSS forwarders manually.
- Ingest web, firewall, DNS, and tunnel logs from Cloud NSS, plus ZPA user-activity JSON forwarded over HTTPS.
- All feeds land in the same network detection and analytics path as other edge / Zero Trust sources.
- Access is invite-only via the
provider_zscalerfeature flag while the integration is in beta.
Released 28th July 2026Incident emails now arrive with useful context even when an investigation needs a little longer, and make the scale of an incident easier to understand at a glance.
Improvements
Incident email delivery
- Flarehawk waits briefly for the investigation summary, then sends a concise deterministic description if it is not ready within three minutes.
- A compact incident snapshot highlights alert volume, request rate, unique IPs, duration, and other available evidence without recreating the full dashboard in the inbox.
- Failed email recipients are retried independently, without resending channels or recipients that already succeeded.
- Acknowledge and mitigation links now open a review step; simply opening an email link never changes incident state.
Released 28th July 2026Joining a team from an invitation now keeps the invitation with you through account creation, email verification, and sign-in.
Improvements
Team invitations
- Invitation emails use one clear Review Invitation action whether you already have an account or need to create one.
- New users return to their pending invitation after verifying their email and signing in.
- Flarehawk prompts invited users to join the existing team before organization setup, preventing accidental duplicate organizations.
- Repeated or differently capitalized email addresses resolve to one active invitation for the same team.
Released 28th July 2026Incident markers on the Overview timeline now open the incidents that began in that time bucket, so operators can move from a traffic spike to the underlying investigation without leaving the chart.
Improvements
Interactive incident timeline
- Select an incident-start marker with a mouse or keyboard to review risk-ordered incident details below the timeline.
- Severity, status, affected asset, alert count, and timing stay visible while active, resolved, and false-positive incidents remain available for historical context.
- Larger buckets load six incidents at a time, with direct links to each incident investigation.
Released 27th July 2026Billing settings now focus on the subscription details and ingest information customers actually need.
Improvements
Subscription and usage
- Subscription now shows the current entitlement, renewal date, payment methods, and cancellation controls without the plan-comparison estimator.
- Usage focuses on accepted ingest by day and domain, without commercial preview metrics that are not active for the account.
- Subscription management and accepted-ingest telemetry remain available when internal billing-period or Enterprise-contract reconciliation is pending.
Released 27th July 2026The How it works incident walkthrough on the Flarehawk landing page now responds to scrolling on phones and tablets, just as it does on desktop.
Improvements
Mobile product tour
- One pinned incident view now moves through Watch, Detect, Connect, Understand, Fix, and Remediate as you scroll.
- A compact layout keeps the important evidence and controls readable on smaller screens, while the section heading remains visible throughout the walkthrough.
- Step controls are tappable, and reduced-motion preferences continue to receive a static version of the story.
Released 26th July 2026Weekly security report emails are easier to read and easier to act on, with plain-language threat descriptions and accurate traffic figures.
Improvements
Weekly security reports
- Refreshed typography, spacing, and text contrast make the email easier to read across mail clients, in both light and dark mode.
- Headline metric cards are consistently sized and aligned.
- Detected threats are described in plain language rather than technical detector names, each count is labelled, and a short lead-in explains what the section shows.
- When accepted data volume is not yet available for the period, the leading metric shows the request count instead of reporting 0 GB.
- A simpler footer keeps report settings and unsubscribe in one place.
Released 25th July 2026Google Workspace connections now explain when administrator authorization needs attention and guide organization owners and admins through a safe, in-place recovery.
Improvements
Reconnect recovery
- Owners and admins receive an in-app alert and operational email when a Google Workspace connection genuinely needs reauthorization.
- Connection lists and detail pages show a clear Reconnect required state; members are directed to contact an organization owner or admin.
- Reauthorization is bound to the affected connection and verifies the same Google Workspace before restoring collection.
- A successful reconnect keeps the connection, assets, source selections, and ingest progress intact, then confirms recovery in the dashboard.
Released 25th July 2026Signing in now chooses the right path before contacting an enterprise identity provider, and unverified accounts return to a clear verification flow instead of stopping at a generic error.
Improvements
Sign-in and email verification
- Enterprise domains with a verified SSO configuration go directly to their identity provider; other users continue to password sign-in or account creation without an unnecessary SSO lookup.
- If an SSO configuration changes during sign-in, the form safely falls back to password sign-in.
- Users whose password is correct but whose email is still unverified return to the verification-pending page, with their intended destination preserved after verification.
Released 23rd July 2026Connect platforms without a native Flarehawk connector by sending JSON events over the Splunk HTTP Event Collector protocol. Vigil helps map fields so events land in Logs and analytics cleanly.
New features
Custom source
- Add a Custom source from Manage → Connections to get a dedicated HEC endpoint and authorization token.
- Point any Splunk HEC–compatible sender at Flarehawk; events appear under the connection’s source asset.
- Protocol guidance and the ingest URL stay visible on the connection detail page so setup is easy to share with your logging team.
Vigil Inspect
- On the Custom source detail page, Vigil Inspect reviews sample payloads and proposes a field mapping profile.
- Confirm the profile when the required canonical fields look right — analysis stays off until mapping is confirmed.
Released 22nd July 2026Flarehawk’s AI security analyst is now Vigil. The rename covers the dashboard, Threads, Slack, SMS, and agent prompts. Existing investigations keep working.
Improvements
Vigil rename
- Chat, Threads, and investigation copy now say Vigil instead of Aegis.
- Durable threads remain the primary way to work with the agent — header, incident, and log Investigate actions open a Vigil thread.
- Cloudflare worker script names stay
flarehawk-aegis*for Durable Object continuity; product branding is Vigil everywhere else.
Released 22nd July 2026Vigil no longer opens in a side panel. Every investigation starts as a durable Threads conversation you can return to later.
Improvements
Threads-first Vigil
- The header Vigil control, incident nudge, and log Investigate actions create or resume a thread and take you to
/threads/{id}. - Page context (route, incident, log event, and filters) is carried into the thread so Vigil keeps the same investigation scope.
- Continue work from Threads in the sidebar — chat, evidence, and run traces live on the thread page.
Released 22nd July 2026The Okta integration documentation now follows Okta Integration Network configuration-guide requirements for customer admins.
Improvements
Okta configuration guide
- The Okta integration guide now includes dedicated Prerequisites, Supported features, Configuration steps, and Troubleshoot sections.
- Scope, Event Hook vs poller delivery, remediation, and revocation guidance are grouped for admins installing Flarehawk from the Okta Integration Network.
Google WorkspaceProvidersAnalyticsDetection
Google Workspace audit monitoring is now generally available
Released 19th July 2026Google Workspace is now available to connect from Manage → Connections through a managed, read-only administrator OAuth flow.
New features
Google Workspace integration
- Connect one Workspace customer and select Login, Admin, Drive, and Gmail activity; all four are enabled by default.
- Login, Admin, and Drive combine fast push notifications with completeness polling. Gmail uses bounded polling because Google does not provide push delivery for that Reports application.
- Connection health shows source cursors, ingest lag, source-specific permission or edition errors, and watch-channel expiry.
- Four provider-isolated analytics pages cover sign-ins, administrator changes, Drive sharing and downloads, and Gmail access and policy activity.
- New detections cover login failure bursts, privilege and policy changes, external sharing, bulk downloads, forwarding, delegation, and bulk mailbox access or deletes.
- Reauthorization updates credentials without losing poll cursors, and deletion stops watches and revokes the grant when Google accepts the cleanup request.
Released 19th July 2026Okta connections now have a dedicated identity analytics dashboard for System Log activity.
New features
Okta Identity analytics
- Open Analytics → Okta → Identity for System Log volume, authentication and session activity, MFA events, and user lifecycle changes.
- KPI tiles highlight failed/denied outcomes, distinct users, and source IPs, with top event types, users, and IPs for investigation.
- Hover any source IP for geo/ASN enrichment, and click users, event types, or IPs to open matching System Log rows in Logs.
- Microsoft mailbox / audit / sign-in panels and Cloudflare Top Attacker IPs use the same IP enrichment popover and log deep-links.
- The dashboard lights up automatically once Okta System Log events are ingesting for your organization.
Released 19th July 2026Auth0 connections now use a Machine-to-Machine application you create in your own Auth0 tenant.
Improvements
Auth0 connect flow
- Create an M2M app in your Auth0 tenant, authorize Management API scopes, and paste the tenant domain, Client ID, and Client secret into Flarehawk.
- Flarehawk stores credentials per connection and mints short-lived Management API tokens with client credentials — no Flarehawk-hosted Auth0 OAuth app.
- Flarehawk prefers an auto-provisioned HTTP Log Stream when your Auth0 plan supports it; otherwise the connection stays active and the Management API poller is the primary delivery path.
- Keep the M2M app first-party and leave Client ID Metadata URL empty — third-party / CIMD apps cannot authorize the Auth0 Management API.
BillingDashboardReportsEmailVigilNotifications
Clearer billing meters, weekly report emails with ingest GB, and better Vigil SMS replies
Released 19th July 2026Organization billing is easier to scan, weekly security reports match light/dark clients with accepted-ingest KPIs, invoice history loads reliably again, and Vigil SMS/iMessage replies stay complete with clearer multi-org routing.
Improvements
Organization billing
- The Enterprise plan card summarizes your contracted terms in a compact layout, with a short tip that term changes go through support while Free, Detect, and Investigate stay self-serve.
- Accepted ingest and AI case allowances show as progress meters next to trailing-30-day and invoice estimate tiles.
- Usage charts plot accepted ingest volume in GB/TB (not event counts), including daily totals and the by-domain breakdown.
- Invoice history loads successfully instead of failing with a server error, and empty states explain when no Stripe invoices are available yet.
Weekly security reports
- Report emails use a light-first layout with a dark brand header, and switch to a dark theme when your client prefers dark mode — without a forced heavy dark background.
- Traffic KPIs lead with Ingested (accepted data volume in GB/TB) instead of event counts, aligned with organization billing.
Vigil SMS and iMessage
- Replies no longer cut off mid-sentence on SMS/iMessage.
- When a turn includes analytics visuals, Vigil can attach chart images in the reply.
- One phone number can cover multiple organizations: Vigil asks which org to use, and
org/switchchange it later. - iMessage contact sharing shows Flarehawk as the sender name when available.
Released 17th July 2026Eligible organizations can connect Imperva and bring WAF / API Security SIEM logs into Flarehawk alongside other network providers.
New features
Imperva beta integration
- Connect with Imperva API credentials; Flarehawk discovers sites and configures SIEM log delivery where your account allows it.
- Imperva WAF events appear in the shared log viewer and feed the provider-agnostic analytics pipeline.
- Access is invite-only via the
provider_impervafeature flag, matching the Akamai beta rollout pattern.
Released 17th July 2026Vigil threads now keep the conversation readable while organizing scope, assessments, visuals, and evidence in one responsive investigation workspace.
Improvements
Vigil investigation threads
- Thread scope shows the saved provider, connection, assets, incident or alert, priority, status, and time range immediately, then refreshes current entity state without losing historical context.
- Charts, time series, tables, log samples, enrichments, coverage, timelines, and attachments collect in a dedicated desktop rail or mobile investigation drawer.
- Chat messages use a wider reading column, clearer Vigil and responder roles, compact completed checks, and artifact references that open the corresponding evidence instead of duplicating full visuals in the transcript.
LandingSecurityPricingBillingOnboarding
Accepted-data pricing, clearer plan selection, and stronger browser security
Released 15th July 2026Flarehawk.com now uses stricter per-request browser protections to reduce the risk of injected content while keeping forms, analytics, and support tools working as expected.
New features
Pricing and billing
- Pricing is now based on accepted data volume and completed AI investigation cases, with clear Free, Detect, Investigate, and Enterprise options.
- One shared calculator recommends a plan from expected data, AI usage, and retention on the pricing page, during onboarding, and in organization billing.
- Organization billing now shows accepted GB, AI cases, forecast usage, estimated period cost, independent caps, pending changes, and Enterprise terms.
- SSO and SCIM are included on every plan, including Free.
Guided onboarding
- New organizations move through usage planning, terms and caps, verified activation, and connection setup in one guided sequence.
- Enterprise requirements can be submitted without blocking an eligible owner from continuing on Free while the request is reviewed.
Improvements
Website security
- The website now uses nonce-based Content Security Policy headers to limit which scripts can run.
- Security policy reports are handled through a hardened endpoint so blocked content can be investigated safely.
Released 14th July 2026MCP OAuth tokens are now bound to the resources they were granted for, so integrations stay scoped to what you authorized.
Improvements
MCP and API access
- Existing MCP OAuth sessions without a resource binding are cleared for safety. Reconnect your MCP client (or re-authorize the Flarehawk OAuth app) once after this release to continue using MCP tools.
LogsArchiveVigilConnectionsOnboarding
Archived log search, durable Vigil threads, and faster week-long investigations in production
Released 13th July 2026This production release brings archived telemetry search, durable Vigil investigation threads, and clearer boundaries when log queries cross from hot storage into archive ranges.
New features
Archived log search
- Investigations that need telemetry older than your organization’s hot retention window can queue an archived log search instead of returning empty results or hanging on ClickHouse.
- Log search and stats now return explicit guidance when a time range is outside hot retention, pointing responders to the cold-search path for archive-backed ranges.
Vigil investigation threads
- Saved Vigil threads keep durable chat timelines with an investigation brief tool and a gated context panel for reviewing evidence alongside the conversation.
- Thread investigations can pull flexible analytics scope so charts and provider context stay aligned with the connection or incident under review.
Connection tools inventory
- Connection detail pages include a tools table showing which provider capabilities Flarehawk exposes for that connection.
- A read-only Cloudflare API executor lets Vigil inspect connection-backed Cloudflare resources without leaving the investigation flow.
Onboarding brand prefill
- New organizations can start with name, logo, and company details prefilled from the signup email domain instead of typing everything manually.
Improvements
Logs and investigations
- The log viewer fetches seven-day filtered searches in bounded windows so wide-range investigations complete instead of hanging.
- Provider filters are modular, making it easier to narrow large log sets to the connection or dataset you care about.
- Billing checkout and portal redirects are hardened so customers are not sent to unexpected external destinations.
- Notification webhooks validate destinations more strictly before delivery attempts.
- Intel and detections can use device-sharing context to explain heavily shared egress and reduce noisy per-IP alerts.
Released 10th July 2026Log searches now stay responsive when you filter across a full week of traffic, and teams can connect Okta using org-local API Service credentials.
New features
Okta integration
- Teams can connect Okta through the Flarehawk integration in the Okta Integration Network using org-local API Service client credentials.
- Okta System Log events arrive through a low-latency Event Hook with scheduled completeness polling for events that are not hook-eligible.
- Identity incidents backed by Okta telemetry can suspend a compromised user and later roll back that suspension from the incident workflow.
- Okta credentials are encrypted per connection, and deleting a connection removes its provisioned Event Hook when the Okta grant remains valid.
Improvements
Logs
- The log viewer now fetches seven-day filtered searches in bounded windows so wide-range investigations complete instead of hanging.
- Provider filters are modular, making it easier to narrow large log sets to the connection or dataset you care about.
Released 10th July 2026Eligible organizations can now connect Akamai directly with EdgeGrid API credentials, choose the properties they want to monitor, and let Flarehawk provision DataStream delivery and SIEM polling automatically.
New features
Akamai beta integration
- The connection wizard discovers eligible Akamai properties and matches protected hostnames to their Application Security configurations.
- Flarehawk-managed DataStream 2 destinations deliver HTTP telemetry without requiring customers to build log endpoints themselves.
- Akamai SIEM security events and DataStream HTTP logs appear in the shared log viewer and feed Flarehawk’s provider-agnostic analytics pipeline.
Released 10th July 2026Eligible organizations can now connect an Auth0 tenant and bring authentication, MFA, user lifecycle, and administrative events into Flarehawk.
New features
Auth0 integration beta
- Organization admins connect Auth0 by creating a Machine-to-Machine app in their Auth0 tenant and pasting the client credentials into Flarehawk.
- Flarehawk automatically provisions and maintains an authenticated Auth0 Log Stream, with scheduled polling as a fallback delivery path.
- Auth0 tenant events appear in the log viewer with provider-specific labels and normalized action, outcome, actor, and source details.
LandingConnectionsIncidentsVigil
Clearer marketing story, connection tools inventory, and incident sharing polish
Released 8th July 2026The marketing site now tells a clearer product story, connection pages surface the tools Flarehawk can run for each provider, and shared incident links look consistent across the dashboard and public view.
New features
Connection tools inventory
- Connection detail pages now include a tools table so teams can see which provider capabilities Flarehawk exposes for that connection.
- A read-only Cloudflare API executor lets Vigil and the dashboard inspect connection-backed Cloudflare resources without leaving the investigation flow.
Improvements
Marketing and incidents
- The landing page pins a clearer “How it works” incident demo, unifies primary calls to action, and simplifies the home page narrative.
- Incident share links and the public incident view now use aligned copy and layout so recipients see the same story responders see internally.
Released 4th July 2026New organizations can start with name, logo, and company details prefilled from the signup email domain instead of typing everything manually.
New features
Onboarding brand prefill
- Organization onboarding can prefill branding and company details from the email domain used at signup.
- When brand lookup is unavailable, onboarding falls back to the standard create-organization form without blocking signup.
VigilBillingNotificationsIntelDetections
Durable Vigil threads, safer billing redirects, and richer device context
Released 2nd July 2026Vigil threads now keep durable investigation timelines, billing and notification flows are harder to redirect off-site, and Intel surfaces device-sharing context for noisy shared IPs.
New features
Vigil investigation threads
- Saved Vigil threads now keep durable chat timelines with an investigation brief tool and a gated context panel for reviewing evidence alongside the conversation.
- Vigil analytics scope is more flexible so thread investigations can pull the right charts and provider context without leaving the thread.
Improvements
Billing, notifications, and Intel
- Billing checkout and portal redirects are hardened so customers are not sent to unexpected external destinations.
- Notification webhooks validate destinations more strictly before delivery attempts.
- Intel and detections can use IPInfo device-count context to explain heavily shared egress and reduce noisy per-IP alerts.
VigilDashboardPricingAdminPrivacy
Private Vigil threads, richer investigations, localized pricing, and admin broadcasts
Released 1st July 2026Flarehawk now gives teams a more visual Vigil investigation workspace, private-by-default saved threads with explicit sharing, localized plan pricing, and a safer admin broadcast workflow.
New features
Vigil investigation workspace
- Saved Vigil thread pages now include a split investigation panel with Brief, Fabric, and Charts tabs, making evidence, graph context, and visualized results easier to review alongside the conversation.
- Incident- and asset-scoped threads can show Fabric relationship graphs directly in the thread, with a link back to the full Fabric explorer when teams need deeper graph analysis.
- Vigil investigation summaries now pull out structured facts, hypotheses, evidence, containment steps, missing data, and confidence so responders can scan the current state faster.
- Draft response actions from Vigil now support preview and apply flows from the thread UI instead of appearing as inactive suggestions.
Localized pricing
- The marketing site and dashboard pricing surfaces can now show localized plan amounts based on the viewer’s region, with a region override for comparing currencies.
- Checkout sessions are ready for Stripe Adaptive Pricing so eligible customers can see localized subscription pricing through the purchase flow.
Admin broadcasts
- Admins can now compose and send product broadcast emails with configurable sender and reply-to details.
- Broadcast content uses the same email address formatting and logging helpers as lifecycle emails, reducing inconsistencies between admin-sent and automated messages.
Improvements
Vigil thread privacy and sharing
- New Vigil threads are private to their creator by default unless explicitly shared with teammates or the whole organization.
- Thread lists and detail pages now show clearer private or organization-wide visibility, and the share dialog supports both per-user grants and org-wide sharing.
- Thread access checks now apply consistently across list, detail, update, delete, share, and live WebSocket transcript paths.
VigilDashboardLogsReportsDetectionsOnboarding
Richer Vigil investigations, faster log searches, cleaner reports, and fewer noisy incidents
Released 29th June 2026Flarehawk now has a more capable Vigil investigation workspace, faster log searches across larger time ranges, more accurate weekly report incident totals, and tighter false-positive handling before incidents are opened.
New features
Richer Vigil investigations
- Vigil chat now supports text attachments so teams can include relevant investigation context directly in a thread.
- Vigil can render structured results as inline charts, with downloadable CSV and SVG exports for chart-backed answers.
- Suggested follow-up actions can appear as quick-reply chips, making it easier to continue an investigation from the evidence Vigil just gathered.
- The chat composer now renders inline
@mention chips so teams can scope questions to a specific connection without breaking the sentence they are typing.
Improvements
Vigil reliability and scope
- Vigil threaded chat now preserves restored transcripts, avoids duplicate startup prompts, and keeps thread replies scoped to Flarehawk investigation tools.
- Connection mentions now carry through to traffic analytics and coverage checks, so Vigil answers from the selected connection instead of falling back to broader or misleading scope.
- When the model is temporarily at capacity after tool checks complete, Vigil now summarizes the retrieved evidence instead of showing a generic capacity message.
- Vigil replies hide internal table and dataset names from operator-facing answers.
Logs, reports, and detections
- The log viewer now searches large time ranges in bounded windows, reducing hangs on wide-range investigations while preserving active filters.
- Weekly reports now count newly created incidents from ClickHouse instead of deriving incident totals from alert rows.
- Low-confidence blacklist feed matches now pass through AI precheck before incident creation, reducing noisy false-positive incidents.
- False-positive suppression is shared across analysis workers, so repeated benign activity is suppressed more consistently.
Dashboard and onboarding
- Vigil thread pages now use the dashboard header for priority, status, sharing, incident links, archive actions, and provider tools.
- Users who already own an organization are no longer forced through a duplicate organization creation step during onboarding.
- Country labels in analytics, reports, logs, and evidence surfaces now use consistent names and flags.
VigilDashboardOrganizationsIntelReportsFastlyConnections
Chat-first dashboard, organization setup, Fastly beta, Intel polish, and report delivery defaults
Released 21st June 2026Flarehawk now opens into a chat-first Vigil workspace for eligible teams, with saved investigation threads, richer provider context, smoother organization setup, cleaner Intel views, and more predictable weekly report delivery.
New features
Chat-first Vigil workspace
- Eligible organizations can use a new Vigil home experience that starts from security questions and investigation context instead of a static dashboard.
- Vigil conversations are saved as threads, with thread detail pages, sharing controls, and mentionable entities so teams can return to prior investigations.
- Connection detail pages now surface a provider tool inventory, making it clearer which Vigil actions are available for each connected provider.
- Vigil activity summaries show the tools used during an investigation, and generated thread titles are cleaner when teams save or revisit a conversation.
- Organization admins can manage early-access feature flags from the organization settings surface.
Intel and Fabric investigation polish
- Intel lookup views are easier to scan, preserve explicit lookup types, and provide better enrichment handling for IP searches.
- Fabric graphs better preserve node hierarchy and make the toolbar easier to use while navigating large relationship maps.
Improvements
Dashboard navigation and tables
- The dashboard home/overview routing is cleaner and keeps the sidebar aligned with the chat-first experience.
- Vigil thread pages avoid duplicate titles and can recover a saved startup prompt that did not receive an answer after a stale worker deploy.
- Creating another organization is smoother from onboarding or an active dashboard session, with clearer plan eligibility and free-plan guardrails before checkout.
- Multi-organization sessions preserve the selected organization across Vigil home, threads, and early-access gates, reducing surprises when switching workspaces.
- Connections use a more compact table layout, and logs hide noisy generic columns by default.
- Analytics landing pages show clearer fallback states when a provider or dataset has no data yet.
Fastly beta
- Fastly is now available in beta from the connection picker without a rollout flag.
- Fastly HTTP and WAF telemetry now feeds the same analysis pipeline used for durable features, request scoring, analytics, and detection workflows.
Weekly reports
- Weekly report defaults now align around Sunday at 08:00 UTC, matching the dedicated reports worker handoff and reducing timing surprises for new report settings.
Released 20th June 2026The dashboard now has a cleaner left sidebar, provider-grouped analytics navigation, and a rebuilt Fabric graph experience for inspecting traffic relationships without losing context.
New features
Fabric graph overview
- The Fabric graph has been rebuilt with a fluid React Flow layout, clearer node lanes, and a readable overview when no node is selected.
- Fabric summaries now show deduplicated request volume, dataset, and time-window context next to node and edge counts.
- The node inspector highlights graph insights, edge health, and top entities so you can move from a noisy topology view to the relationships that matter.
- IP actions are available directly from Fabric so you can pivot into Intel lookups and response workflows from the graph.
Provider-grouped navigation
- The main dashboard sidebar is lighter and easier to scan, with Analytics grouped by connected provider.
- Reports and analytics use nested navigation so settings, dashboards, and provider-specific views stay close to the surface you are working in.
Released 17th June 2026
Improvements
Organization-aware dashboard actions
- Provider interest and connection actions now resolve against the selected organization, so teams managing more than one org see the right state before submitting a request.
- Dashboard APIs for organization-scoped views consistently follow the active organization selection, reducing cross-org stale data in shared sessions.
Vigil assistant
- Opening Vigil now starts with a helpful welcome state and suggested prompts instead of an empty chat.
- SMS replies from Vigil are shorter and better suited to mobile notifications.
Released 16th June 2026
New features
Intel device-count context
- Intel now uses IPInfo device-count signals to identify heavily shared networks, helping distinguish a single suspicious host from traffic coming through carrier-grade NAT, VPNs, and other shared egress points.
- Shared-network context is available to detection logic, reducing noisy per-IP alerts when high volume is better explained by many devices behind the same network.
Provider-aware analytics pipeline
- Analytics and raw-log views now resolve providers through the shared provider catalog, so Cloudflare, Microsoft, and Fastly datasets behave consistently across dashboards, filters, and availability states.
- Microsoft assets are normalized to the canonical Microsoft provider, preventing legacy Entra or Microsoft 365 labels from hiding activity in analytics and detections.
Released 15th June 2026Microsoft 365 & Entra ID is now in beta and available to connect from Manage → Connections. One admin-consent flow covers Entra sign-in and directory audit logs plus Microsoft 365 unified and mailbox audit activity — with detection rules, analytics dashboards, and Graph remediation actions already wired on the platform.
New features
Microsoft 365 & Entra ID (Beta)
- Connect a tenant with Connect with Microsoft — a Global Administrator grants consent once; Flarehawk stores only your tenant id and polls Microsoft Graph and the Office 365 Management Activity API on your behalf.
- Four log sources are available at connect time: Sign-in Logs, Audit Logs, Unified Audit Log, and Mailbox Audit Log (the M365 audit sources require unified audit logging enabled in Microsoft Purview).
- Mailbox and Audit analytics dashboards under
/analytics/microsoft/…surface identity and productivity audit activity alongside your existing Cloudflare views. - Per-principal statistical detections cover failed sign-ins, MFA spikes, risky sign-ins, mailbox attachment access, and admin changes — with near-real-time polling so alerts land within minutes of upstream activity.
- Response actions include session revocation and other Graph-backed remediation steps where your tenant policy allows them.
Improvements
Analytics sidebar
- The Analytics workspace now lists only providers you have connected, so empty provider groups no longer clutter the sidebar.
- Microsoft analytics panels correctly distinguish no data yet from dataset not enabled, instead of showing misleading empty charts.
Fixes
- Microsoft analytics and connection links use consistent paths after the beta launch.
DashboardFabricEmailsAnalyticsOnboarding
Fabric graph improvements, activation checklist polish, and refreshed emails
Released 14th June 2026
New features
Refreshed lifecycle and incident emails
- Verification, welcome, connect-source, and incident notification emails use consistent branding, on-brand buttons, a compliance footer with settings links, and provider-aware copy.
- Email verification routes through a Turnstile-protected confirm page before completing, so automated scanner clicks cannot verify accounts on your behalf.
Coverage checklist and sample incident
- The activation checklist now includes a telemetry coverage step that surfaces disabled or stale datasets before you rely on them in an investigation.
- Review a sample incident opens a fully populated demo incident so you can explore triage without waiting for a real alert.
Profile-backed dismissible banners
- The dashboard activation checklist and MCP banner are dismissible, with state stored in your user profile so they stay hidden across sessions and devices.
Improvements
Fabric graph and inspector
- The Fabric view now scopes graph context to the connection you are investigating, with clearer selection state and an inspector that deduplicates fields and loads the full connection list for cross-asset context.
- Provider logos appear ahead of provider · connection · asset labels throughout connection and Fabric surfaces.
Fastly CDN analytics
- CDN Security charts for Fastly now populate correctly and include historical activity for the past 90 days.
Billing copy
- User-facing billing, pricing, and usage surfaces now refer to events instead of logs, matching Stripe product naming and the billing docs.
Fixes
- Login email-existence checks respond faster on the sign-in page.
- Fastly connection detail no longer errors when viewing managed logging status.
- Cross-provider log search works reliably when filtering across Cloudflare, Microsoft, and Fastly datasets.
FastlyDashboardOnboardingProvidersDetection
Fastly alpha, activation checklist, and provider catalog expansion
Released 13th June 2026
New features
Native Fastly integration (Alpha)
- Connect Fastly services with an API token — Flarehawk discovers your services, provisions managed HTTPS real-time logging, and streams HTTP and Next-Gen WAF events automatically.
- A Fastly CDN Security analytics dashboard shows request volume, attack-type breakdown, top attacker IPs, and WAF rule activity.
- Fastly events in the log viewer display with correct provider logos, dataset labels, and detail accordions.
- The connection detail page shows managed logging endpoints, live status, dataset management, and repair actions.
- Fastly is marked Alpha on the connection picker and per-provider release badges.
Dashboard activation checklist
- New organizations see a step-by-step activation checklist on the dashboard home: connect telemetry, verify ingest health, configure notifications, invite teammates, and review detections.
Per-provider release badges
- Each provider carries an Alpha, Beta, or GA label on the sidebar, connection picker, and connection detail page.
Provider-scoped analytics URLs
- Analytics dashboards live under
/analytics/{provider}/{dashboard}(for example/analytics/cloudflare/app-security,/analytics/fastly/cdn-security). Legacy paths redirect automatically.
Improvements
Provider catalog and logos
- Provider logos are centralized across the dashboard, landing page, and docs.
- The Integrations and Use Cases landing pages are driven from the same catalog, with audience-segmented use-case groupings.
Connector reliability
- Microsoft 365 connections block cross-tenant reuse when a tenant is already linked to another Flarehawk organization, and surface a clear reconnect state when Microsoft tokens expire.
- Cloudflare auto-remediation rule suggestions are validated more strictly before apply, reducing the risk of overly broad blocks.
Released 12th June 2026
New features
Provider interest and deferred onboarding
- The connection picker shows coming-soon providers with a Notify me action so you can register interest before a connector goes live.
- You can save a connection and finish setup later — deferred connections surface clear CTAs on the dashboard until logging is enabled.
Live events ticker on flarehawk.com
- The marketing homepage events counter reflects real platform ingest volume instead of a static placeholder.
Provider logos across the dashboard
- Every registry provider shows a consistent logo in the connection picker, asset selectors, and analytics chrome.
Improvements
- SSO setup for SAML IdPs walks through metadata upload with clearer validation and error copy.
Fixes
- Provider interest failures no longer hide the full provider list in the connection picker.
- Landing-page hero eyebrow text removed for cleaner above-the-fold messaging.
Released 11th June 2026
New features
Slack Connect improvements
- Paid-plan Slack Connect onboarding sends a clearer welcome message and can invite the Flarehawk support team into your shared channel.
Improvements
- Organization → Infrastructure and Slack Connect status handling received UX polish on the organization overview.
Fixes
- Slack Connect status no longer blocks the welcome message while support-team invites are still processing.
IntelDashboardSlackThemeIncidentsBillingProviders
Flarehawk Intel, light & dark mode, and Slack Connect for paid plans
Released 10th June 2026Three things stand out in this release: Flarehawk Intel gets sharper tooling for investigating attackers, the dashboard is fully polished for light and dark themes, and every paid plan can now opt into a dedicated Slack Connect support channel with the Flarehawk team.
New features
Flarehawk Intel
- Intel lookup lets you search any IP, ASN, CIDR range, or JA3/JA4 TLS fingerprint and read a full profile — Flarehawk Intel Score, cross-customer prevalence, attack profile, behavioral fingerprints, and active campaigns — built from anonymized platform telemetry blended with external enrichment.
- Platform-aware detections automatically raise severity when an entity hitting your perimeter is already corroborated as malicious across the platform, with the evidence attached to the alert.
- JA4 fingerprint breakdown tooltips decode transport, TLS, HTTP, and application layers inline — in Intel results and on the logs table — so you can inspect client tooling without leaving your investigation.
- Intel surfaces, icons, and upsell flows were tuned for readability in both light and dark themes.
Light & dark mode across the dashboard
- Full light / dark / system theme support is now polished end to end: incident headers, share links, sidebar icons, analytics tables, Intel panels, and primary action colors all hold contrast in either mode.
- The command bar and refreshed sidebar keep iconography consistent when you switch themes or follow system appearance.
- Loading skeletons, badges, and status controls were tuned so nothing washes out or clashes between modes.
Slack Connect support for all paid plans
- Every organization on a paid plan can request a private Slack Connect channel with the Flarehawk team — during onboarding right after plan selection, or anytime from Organization → Overview.
- Enter your Slack account email, track invite status (pending, connected, declined), and resend invites when needed.
- This is separate from alert notifications Slack OAuth — alert delivery still posts to your own workspace.
Also in this release
Vigil on every page
- Vigil now receives page-specific context and scoped tools on Intel, incidents, analytics, organization, reports, and settings — so answers stay grounded to what you are looking at instead of only the surfaces that were wired before.
Organization infrastructure and settings
- Organization → Infrastructure leads with connections and moves auto-remediation into per-connection actions.
- Settings matches the organization page design system: clearer account, notifications, and activity tabs, plus an activity log scoped to your own actions.
- Two-factor authentication and connected sign-in providers display correctly on the account tab.
Incident triage and sharing
- The incident detail page has a cleaner header with status, severity, and actions in one bar; status changes use inline confirmation, and the legacy classic layout is retired.
- Incident share links are more reliable when sharing with people outside your organization.
Billing and navigation
- Org admins can open an Attach Product modal from billing to add plans and add-ons without leaving the dashboard.
- Organization switching and first load feel faster across the dashboard.
- Connections, Intel, and Metrics use refreshed animated sidebar icons aligned with page-header breadcrumbs.
Groundwork for additional providers
- Detections and Infrastructure tabs are scoped by provider, and analytics dashboards split along provider lines with clear empty states when a dataset is not enabled.
- The Connections page is ready for additional providers beyond Cloudflare as they roll out.
Detection, reporting, and reliability
- Flarehawk Risk Score accounts for traffic your edge explicitly trusts, reducing false positives on known-good infrastructure paths.
- Weekly security reports default delivery to the org owner when per-member settings are missing.
- The dashboard all-time logs ingested counter is more accurate.
- Vigil sidebar stability improvements and other reliability fixes across the dashboard.
ConnectionsAnalyticsDetectionRemediationDashboardCloudflare
Cloudflare OAuth, rebuilt analytics, and automatic remediation
Released 8th June 2026You can now connect Cloudflare by signing in instead of minting and pasting an API token, your Analytics workspace has been rebuilt into purpose-built Cloudflare dashboards that light up exactly the data you have, and Flarehawk can automatically remediate high-confidence incidents.
New features
Log in with Cloudflare — no more API tokens
- Connecting a Cloudflare account now starts with a single “Login with Cloudflare” button. Sign in through Cloudflare’s OAuth flow and Flarehawk is connected — no more creating a scoped API token by hand, copying it, and pasting it in.
- The connection wizard leads with the OAuth method and keeps “Use an API token instead” as a one-click fallback, so the manual flow you already know is still there if you prefer it.
- Connections stay healthy on their own: access tokens are refreshed automatically in the background, so log discovery, Logpush, remediation, and reporting keep working without you re-authenticating.
- Built with security first — the long-lived refresh token never reaches the browser (it rides in an encrypted, server-only cookie and is revoked when you disconnect), and Flarehawk only requests the Cloudflare scopes it actually needs.
A rebuilt Analytics workspace, purpose-built for Cloudflare
- Analytics is now a set of focused, registry-driven dashboards instead of one catch-all page:
- Application Security — WAF firewall events, attack-type breakdown, top WAF rules and bot management, now with Top Attacker IPs, Top Bot ASNs, DNS Security, and Page Shield. (The old
/analyticslink brings you straight here.) - Zero Trust — device-health and app-test heroes alongside Gateway DNS/HTTP/Network, Access, network sessions, and device posture.
- Cloudflare Account — audit activity, your connection/asset/Logpush inventory, ingestion health, a security-posture rollup, and a cross-dataset activity heatmap.
- Application Security — WAF firewall events, attack-type breakdown, top WAF rules and bot management, now with Top Attacker IPs, Top Bot ASNs, DNS Security, and Page Shield. (The old
- Data-aware greying: panels and whole dashboards automatically dim with a clear empty state when the underlying dataset isn’t enabled or isn’t receiving data, so you can tell “nothing happened” apart from “this source isn’t switched on” at a glance.
- The Analytics sidebar is now grouped by provider in collapsible menus, and every dashboard shares one consistent page shell (header, filter bar, panels) with a back link that preserves your selected organization.
- Dashboards are now correctly scoped to the organization you have selected, and a few long-standing data gaps were fixed along the way — average WAF score is computed from real data instead of showing zero, WAF rule names are enriched, and verified-bot traffic is shown rather than silently dropped.
Automatic remediation
- Flarehawk can now automatically apply targeted, time-bounded Cloudflare mitigations for high-confidence incidents — opt-in per connection or asset.
- Safe by design: a strict severity cap (critical incidents never auto-apply), per-asset hourly/daily rate limits, a complete audit trail, an approval inbox for anything withheld, and a notification on every action. Auto-applied rules expire and roll back on their own.
Light & dark mode, and a command bar
- Full light / dark / system theme support across the dashboard.
- A new command bar (⌘K / Ctrl-K) for instant navigation, backed by a refreshed, registry-driven sidebar.
- The Logs view is richer too — provider logos, a combined details accordion, dynamic columns, and clearer rendering of mail/audit events.
Improvements
Groundwork for more than just Cloudflare
- The Connections page now lists connections across all providers (with a provider column), not just Cloudflare, and the “more services coming soon” placeholder card is gone.
- The provider picker is registry-driven: Cloudflare is connectable today, with groundwork in place for additional providers rolling out behind flags.
Smarter assistant reach
- Vigil is now available as a Slack AI agent, so you can investigate incidents and ask questions without leaving Slack.
- Link your Slack and Flarehawk accounts with a one-time email code, so Vigil recognizes you in Slack even when your Slack email differs from your Flarehawk login.
Sharper detection & triage
- Edge-trust aware detection: traffic your Cloudflare configuration explicitly trusts (a
skipaction) no longer generates false-positive incidents. - Smarter, more reliable AI triage for incident summaries and explanations.
- The network Fabric graph is now a single, source-aware left-to-right flow, making attack paths easier to read.
Fixes
- SAML SSO: IdP-initiated logins are now accepted, fixing Microsoft SSO sign-in failures for organizations that start login from their identity provider.
- Sign-ups: Gmail sign-ups no longer crash with a “URI malformed” error, and several invite/verify 500s were resolved.
- Onboarding: new organizations are no longer silently dropped onto the paid “basic” plan, so the plan chooser appears as intended.
- Landing page: the “money saved” counter now shows a real value and paints server-side instead of flashing zero.
- Two-way SMS: conversation creation is more dependable, and Logpush job names are sanitized to Cloudflare’s allowed character set so log delivery sets up cleanly.
- Incidents: the incident detail and storyline pages are now fully mobile-responsive, and timeline fetch failures surface clearly instead of silently hiding comments and acknowledgements.
- Cloudflare: account-level Logpush is gated behind Enterprise eligibility so setup no longer fails on accounts that can’t use it.
ReportsDashboardVigilDetectionNotificationsAPI
Weekly security reports redesign and public org/connection API
Released 1st June 2026Your weekly security reports got a redesign. We shipped a dedicated reporting service that generates each organization’s report and delivers it by email and Slack every Sunday at 08:00 UTC — led by an AI-written executive summary and richer visual charts. Alongside that, we reorganized incidents into a guided story, modernized the dashboard home, opened up our public API, and taught Vigil to be honest about your telemetry blind spots.
New features
Weekly security reports, delivered reliably
- A new reporting service generates each organization’s weekly report and delivers it both as a branded HTML email and as a post to your connected Slack channel, every Sunday at 08:00 UTC.
- Reports now lead with a short AI-written executive summary of the week’s security activity (with a templated fallback if the summary is unavailable), mirrored across email, Slack, and the in-app Reports page.
- Each report embeds visual charts — severity, top threats, WAF activity, and traffic by country — rendered as images so they display in your mail client and in Slack.
- Single-channel setups (email-only or Slack-only) are handled correctly, so a report is never marked failed for a channel you don’t use.
- You can send a report on demand for testing, through the same email and Slack pipeline as the weekly run.
- This also fixes a crash that had been silently failing every weekly report run, so reports that previously never went out now reach you on schedule.
Public API for organizations and connections
- You can now create, read, update, and delete organizations and connections programmatically through the public REST API using a Flarehawk API key (bearer auth), alongside the existing alerts, domains, incidents, and logs endpoints.
- The new endpoints are documented in the OpenAPI schema.
Vigil can now find your telemetry blind spots
- Ask Vigil about a domain or asset and it can report your real coverage: which log datasets are switched on, how fresh their data is (latest event and ingest lag), how long it’s retained, and any enabled datasets that aren’t actually receiving data.
- Vigil now checks coverage before claiming a dataset “has data” or “has no logs” — so instead of presenting empty results as proof nothing happened, it will say plainly when a source is disabled, missing, or stale (for example, “WAF logs are not enabled for this asset”).
- The same data-coverage view is available through the MCP integration.
Guided, approval-safe remediation through Vigil
- You can ask Vigil what can be done about an incident and it lists the reviewed remediation options (rule type, readiness, current status) without changing anything; it only applies a fix when you explicitly ask for a specific rule.
- Applying still requires you to confirm via the dashboard approval prompt, and Vigil won’t claim a remediation is applied until you’ve confirmed it.
Product updates, in your inbox and in-app
- Flarehawk can now send you product release notes and product-education emails, and surface release updates as in-app dashboard notifications.
- A new Product Updates section in notification settings lets you independently toggle marketing emails, release emails, and release in-app notifications, and every broadcast email includes a one-click unsubscribe link back to your preferences.
Book an onboarding call at sign-up
- New sign-ups are now greeted with an onboarding step that encourages booking a short setup call (embedded Cal.com) to map Cloudflare logs, datasets, and alerting before the first workspace goes live — while still allowing self-serve account creation.
- Users accepting an org invitation skip the gate and go straight to the form.
Improvements
Incidents, reorganized into a guided story
- The incident detail page (and the public shareable incident link) is now structured as a five-step narrative — Detect (what triggered it and how severe), Understand (plain-language AI summary and attacker behavior), Connect (where it came from and what it touched), Fix (remediation suggestions or actions taken), and Resolve (timeline of who did what) — making incidents far easier to follow for technical and non-technical readers alike.
- Vigil grounds its incident explanations in this actual timeline rather than inventing a sequence, and openly flags gaps (analysis pending, no remediation taken, coverage blind spots) instead of filling them with assumptions.
- You can block or allowlist an incident’s source IPs directly from the page.
A modernized dashboard home
- The main overview was rebuilt with a cleaner layout: live KPI tiles, a traffic chart breaking out HTTP/WAF/incident activity, recent incidents and connection summaries, plan-aware timeframes, and polished loading skeletons.
A streamlined Organization page with built-in billing
- The Organization page now opens on an Overview tab (members, assets, connections, plan, renewal, billing email, created date) and uses clean vertical tabs instead of accordions.
- Billing is folded in as a Billing tab (the separate Billing page now redirects here), Identity settings are split into SSO and SCIM, and Members are grouped under Identity & Access.
- Deleting an org now requires typing the org slug and re-authenticating, for safety.
A consistent, refreshed look across the dashboard
- Analytics, logs, fabric graph, connections, detections, organization, billing, and admin pages were brought onto one unified design system — bordered rounded tables, KPI stat tiles, consistent severity and status badges, and modern empty and loading states.
- Cloudflare connections now show the Cloudflare brand mark instead of a generic cloud icon.
- The sidebar was tidied up with a more informative system-status indicator and platform stats, and a redundant Settings link was removed from the footer (Settings remains in the profile menu).
Cleaner, safer Vigil answers
- Vigil no longer renders wide markdown tables that were hard to read in the narrow chat panel — records like incidents, alerts, and assets now come back as compact bullets or short key-value phrases, and it only produces a table if you explicitly ask for one.
- When agents pull logs through the MCP integration, raw payloads and personally identifiable information are now masked by default; retrieving the unredacted data requires an explicit elevated scope and is recorded in the audit log. Your dashboard log and incident views are unchanged and continue to show full detail to authenticated operators.
Sturdier two-way SMS conversations
- Replying to a security alert by text is more dependable: starting or resetting an SMS chat retries automatically instead of replying “Something went wrong.” Texting “new” or “reset” reliably starts a fresh conversation.
Polished social-share preview cards
- Sharing Flarehawk links now generates distinctive, on-brand preview cards (custom fonts and a world-map panel) for indexed pages, instead of a plain default image — across the dashboard and marketing pages (pricing, comparisons, integrations, use cases, and docs).
Fixes
More reliable incident notifications
- Incident alerts that fan out to your team (email, Slack, SMS, and webhooks based on each member’s preferences) now deliver consistently instead of silently dropping.
Correct incident context in shared-number SMS threads
- When the same phone number belongs to people across multiple organizations, an inbound SMS now links the conversation to the right organization’s most recent incident — so replies carry the correct context and threads can’t bleed across tenants.
Tighter, incident-specific remediation suggestions
- Auto-generated remediation rules are now scoped to the specific IPs and paths involved in an incident instead of broad blanket blocks. Overly broad rules (match-everything, country-only, ASN-only, or path-only) are rejected or down-weighted, and auto-apply requires higher confidence — reducing the risk of a suggested block affecting legitimate traffic.
Charts no longer broken in delivered reports
- Embedded report chart images were returning a forbidden error and showing as broken in every email and Slack message because of a secret-name mismatch. Charts now render correctly in delivered reports.
Detections lands on a populated rule catalog
- Opening Detections (including via the redirect from the old /detections URL) now auto-selects the first active asset and recovers if the selected asset is suspended, so you see a populated rule catalog instead of an empty “No asset selected” state.
Vigil investigations start reliably on every scope
- Resolved an issue where an investigation context containing special (non-ASCII) characters could cause the Vigil assistant connection to be rejected. The scope is now transmitted in an encoding-safe form, so these chats start reliably.
DashboardDetectionCloudflareNotifications
Flarehawk Risk Score beta, audit logs, and managed blocklist
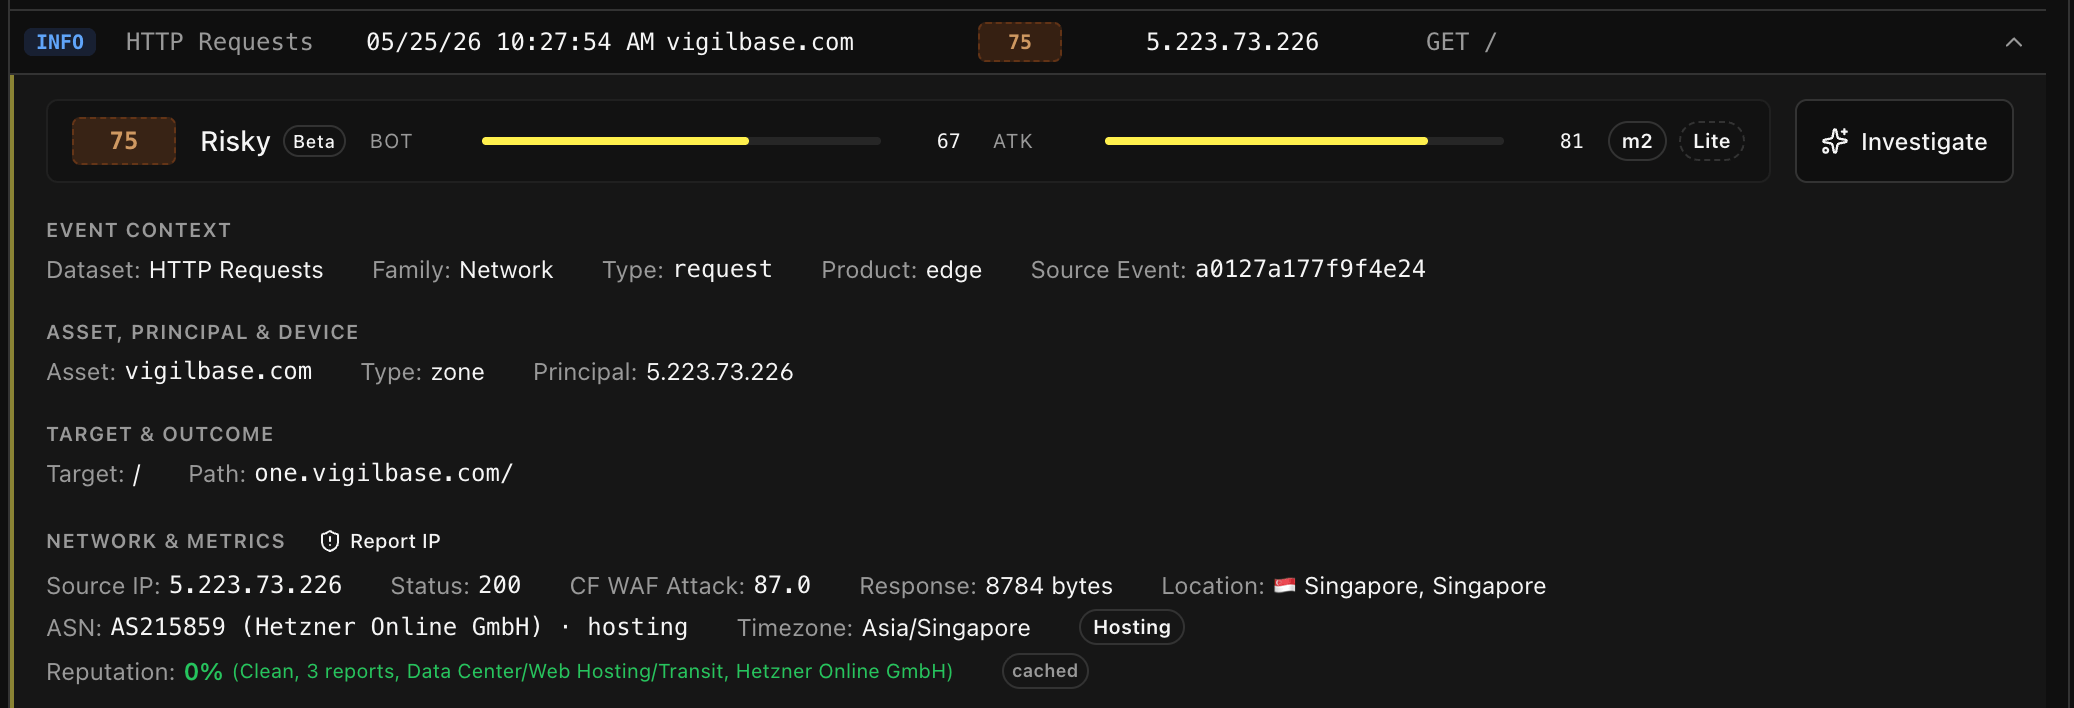
Released 25th May 2026We introduced the Flarehawk Risk Score, which assigns a score to each event Flarehawk processes. For now, FRS scores cover Cloudflare HTTP and WAF events; we are expanding them across additional Cloudflare datasets and new integrations.
New features
New Documentation
- We have centralized all Flarehawk documentation, including API specifications to docs.flarehawk.com, available now!
Flarehawk Risk Score (FRS) — beta
- Risk scores are now available for Cloudflare HTTP and WAF datasets.
- Three score states are shown in the UI:
- Calibrated — score is fully tuned to your traffic.
- Lite — base score active; personalized tuning not yet complete.
- Warming up — still learning your environment.
- New risk score filter on the logs page with a live slider.
- Every event is labeled as Risky, Caution, or Safe.
Delegated Agent Auth
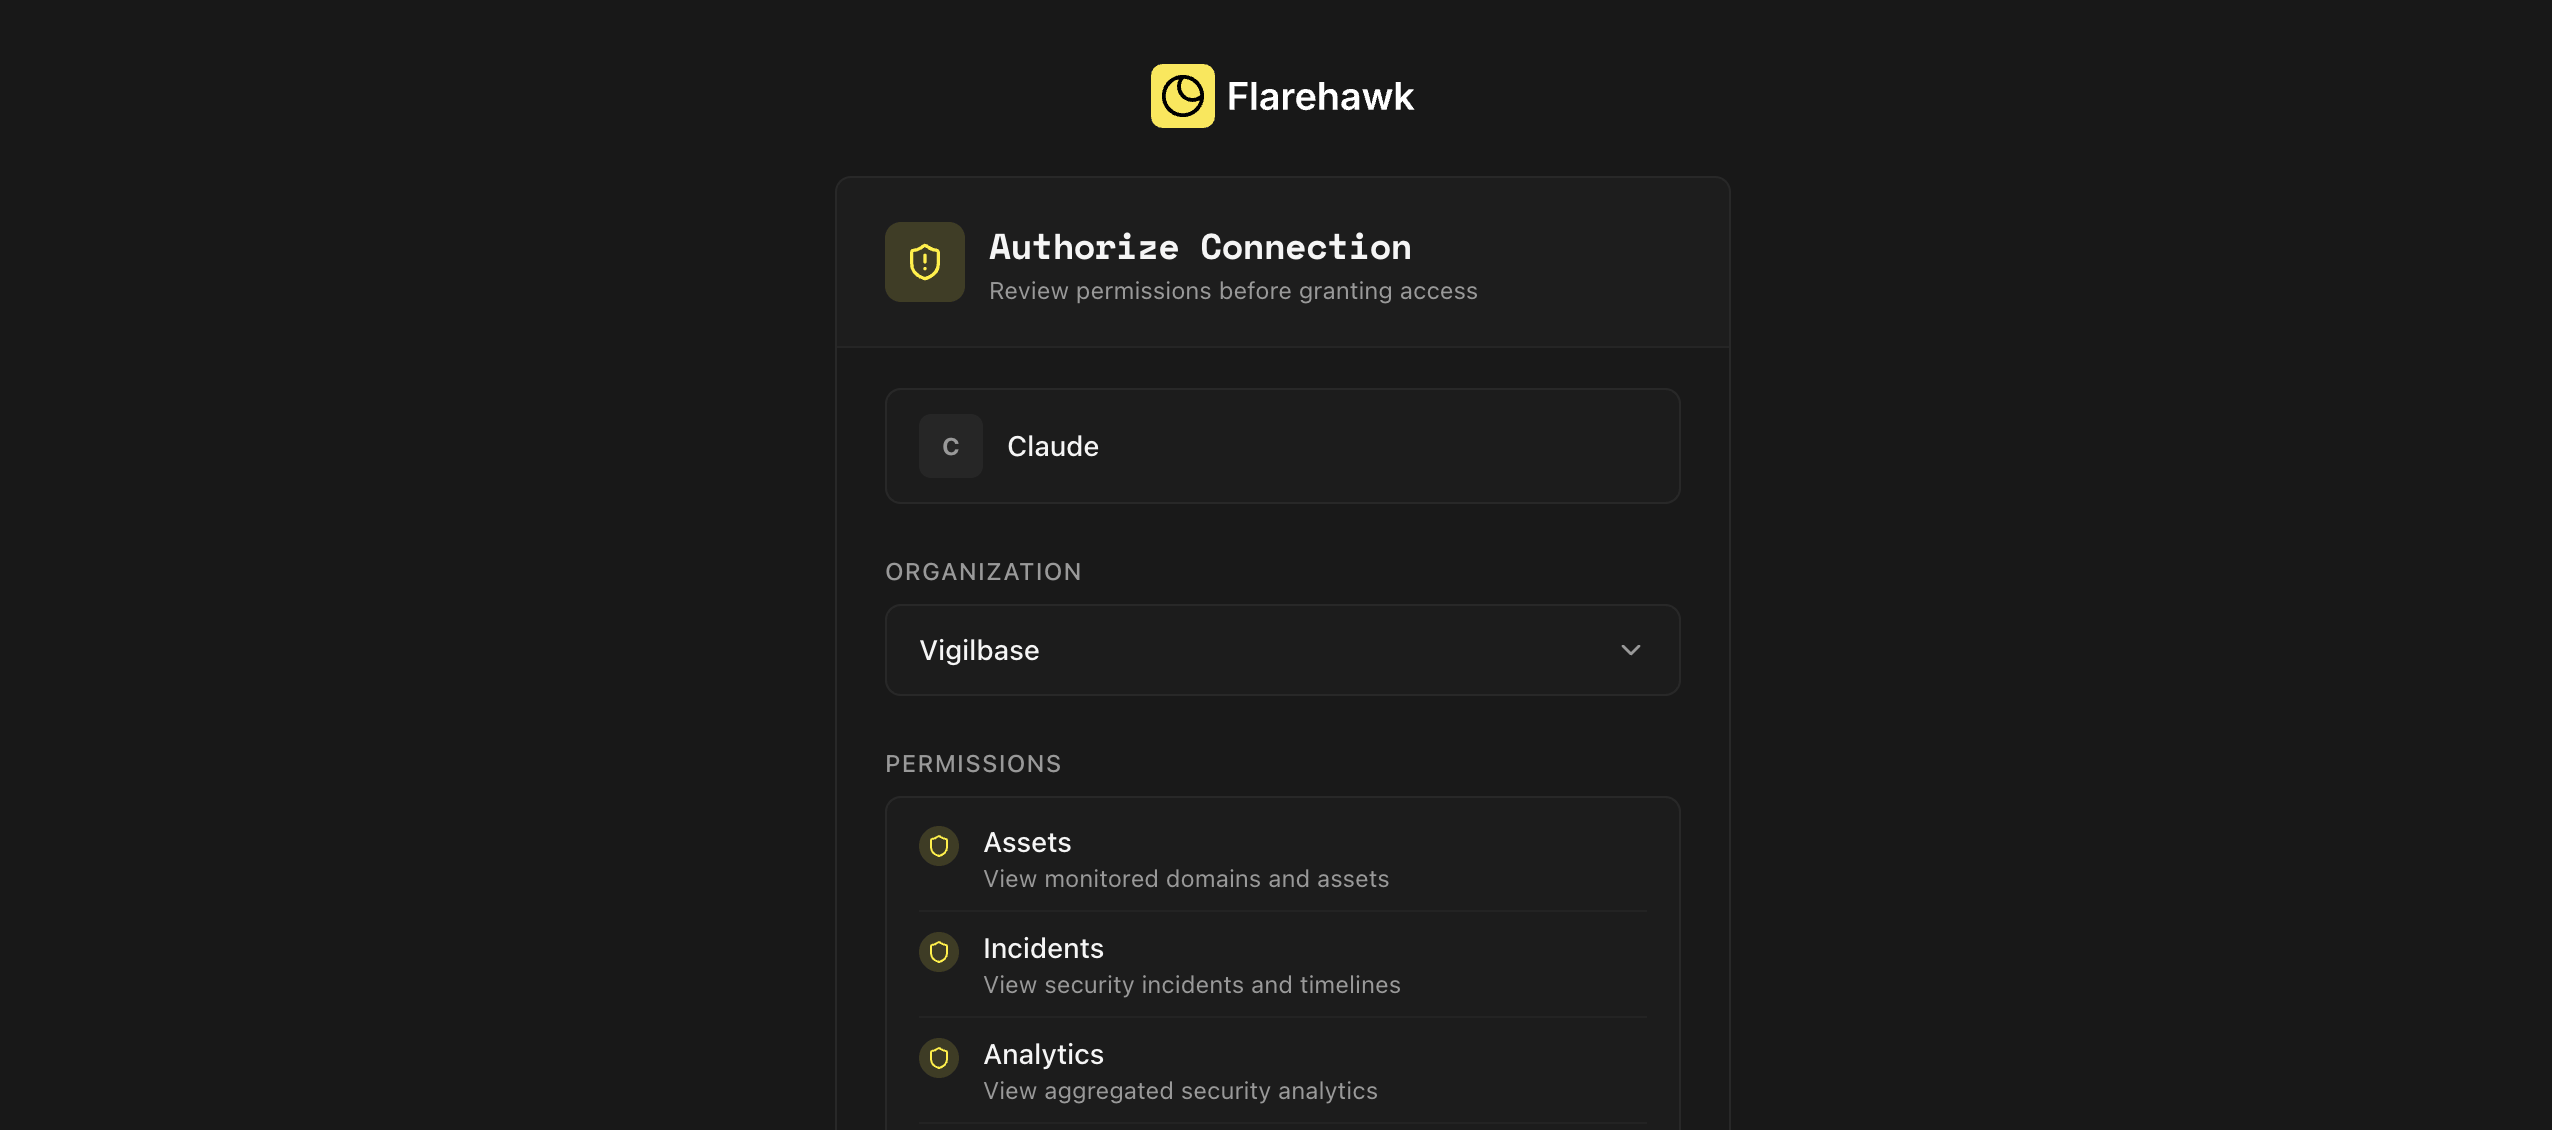
- Flarehawk now supports agent authentication, using the auth.md standard. Try it today by asking your favorite agent to login to Flarehawk.
- Approve third-party agent access to your organization through a dedicated approval flow.
- Approvals are scoped per-request and include user-code verification.
Audit logs
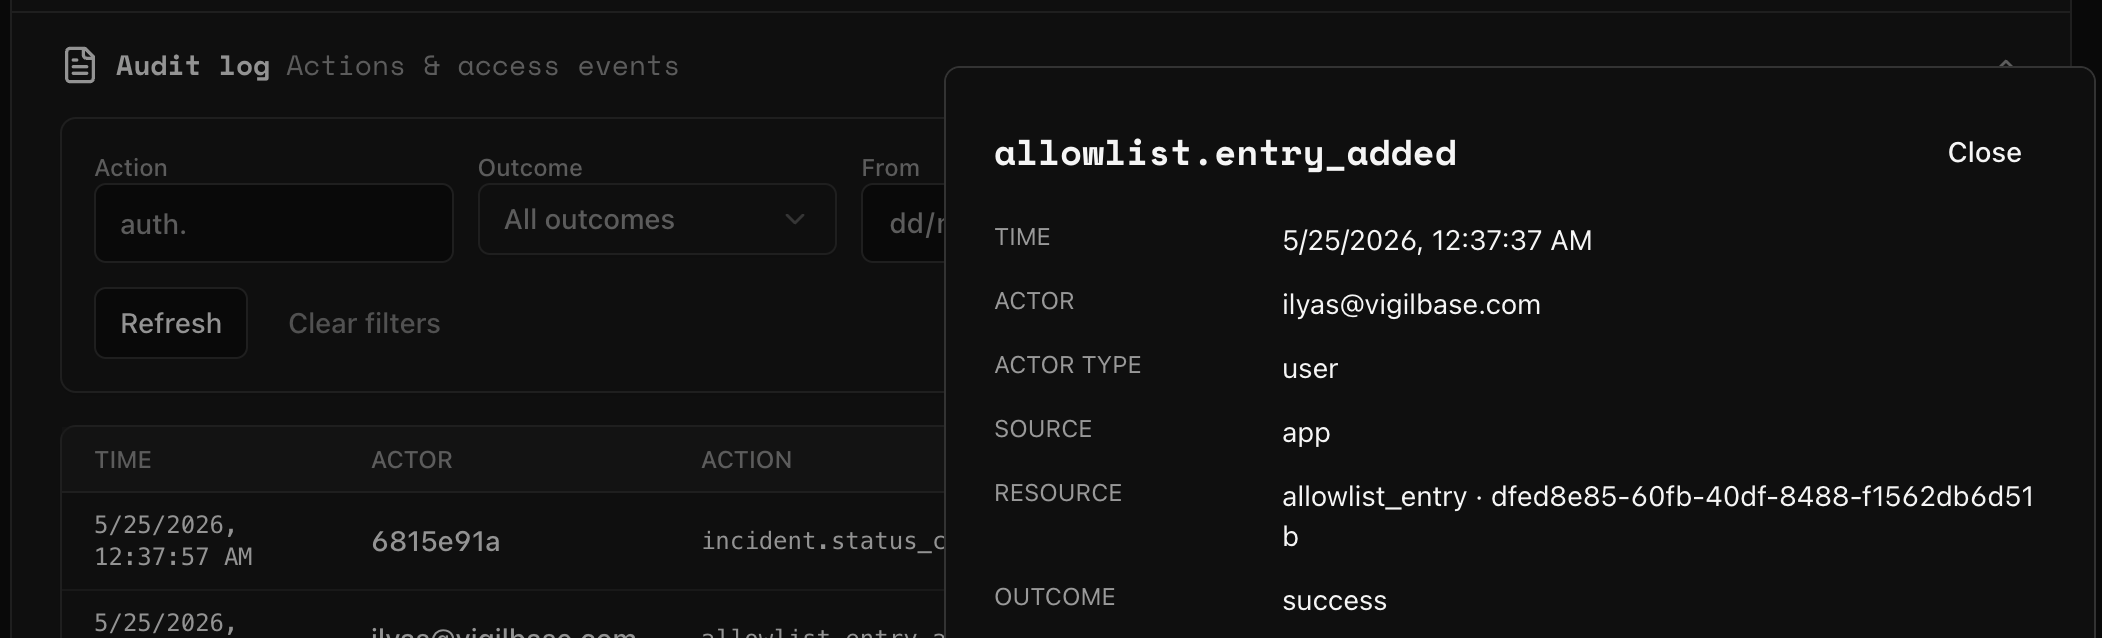
- Full audit trail covering organization, member, asset, connection, billing, incident, and authentication events.
- New Settings → Audit log view for org admins and owners, with filters by action type and outcome, plus a detail drawer for each event.
Managed Cloudflare Blocklist
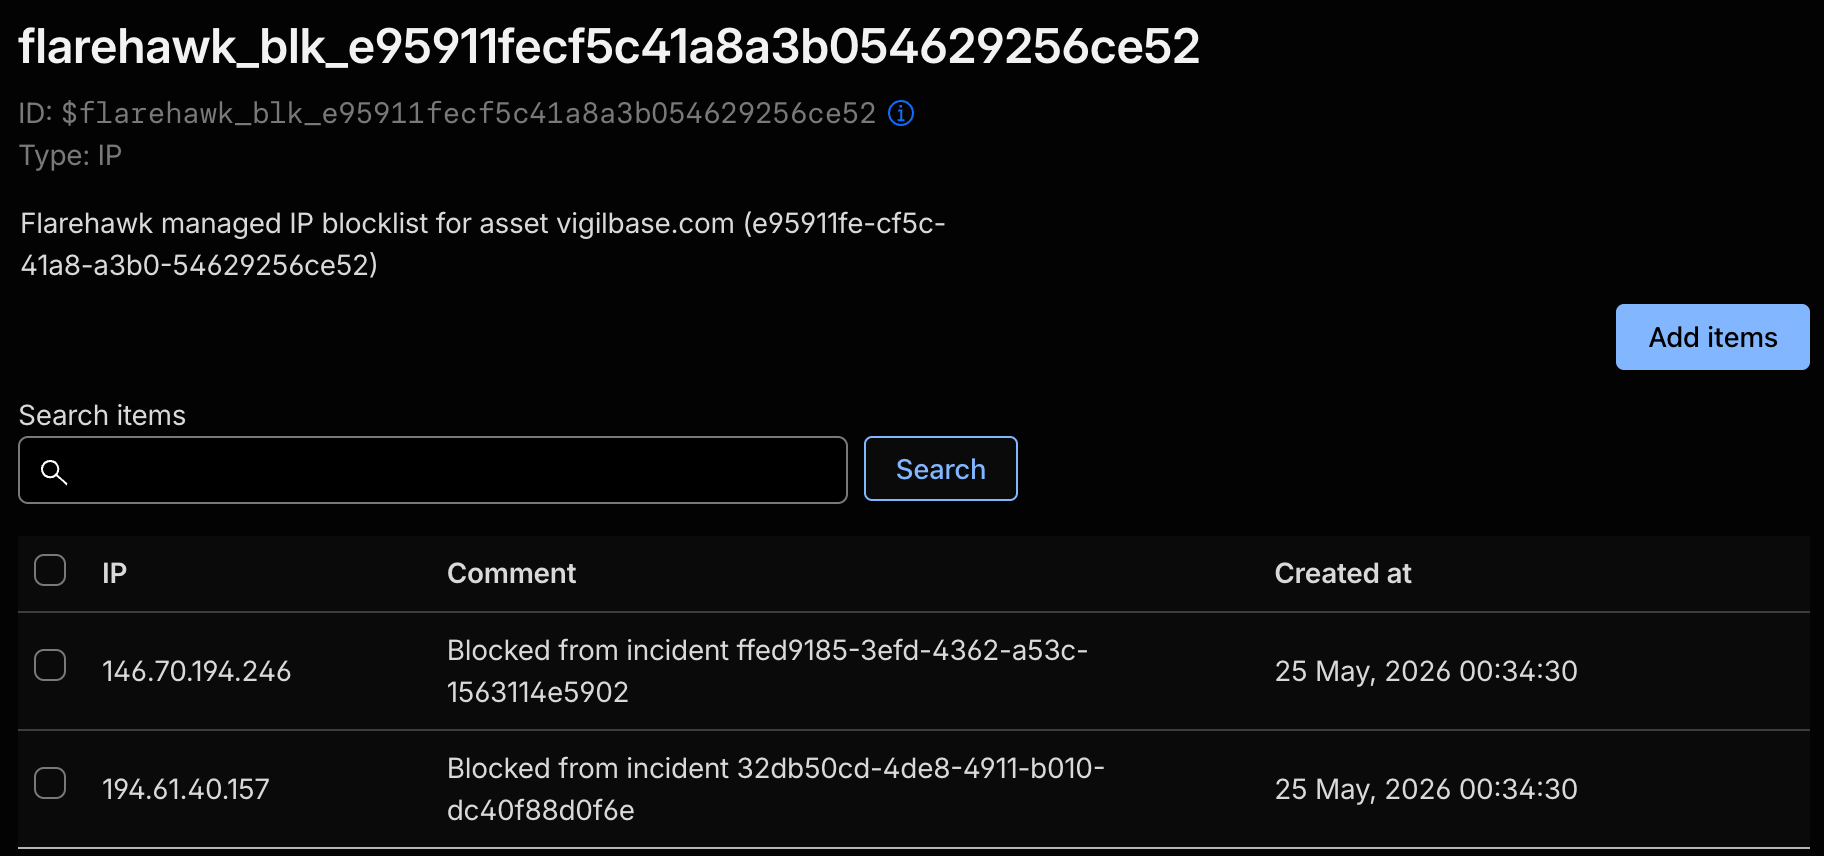
- Blocked IPs will now be used not only to improve our detections, but are now synced to Cloudflare
- Flarehawk creates a managed list per each domain, and then a blanket WAF rule to block all IPs in the list.
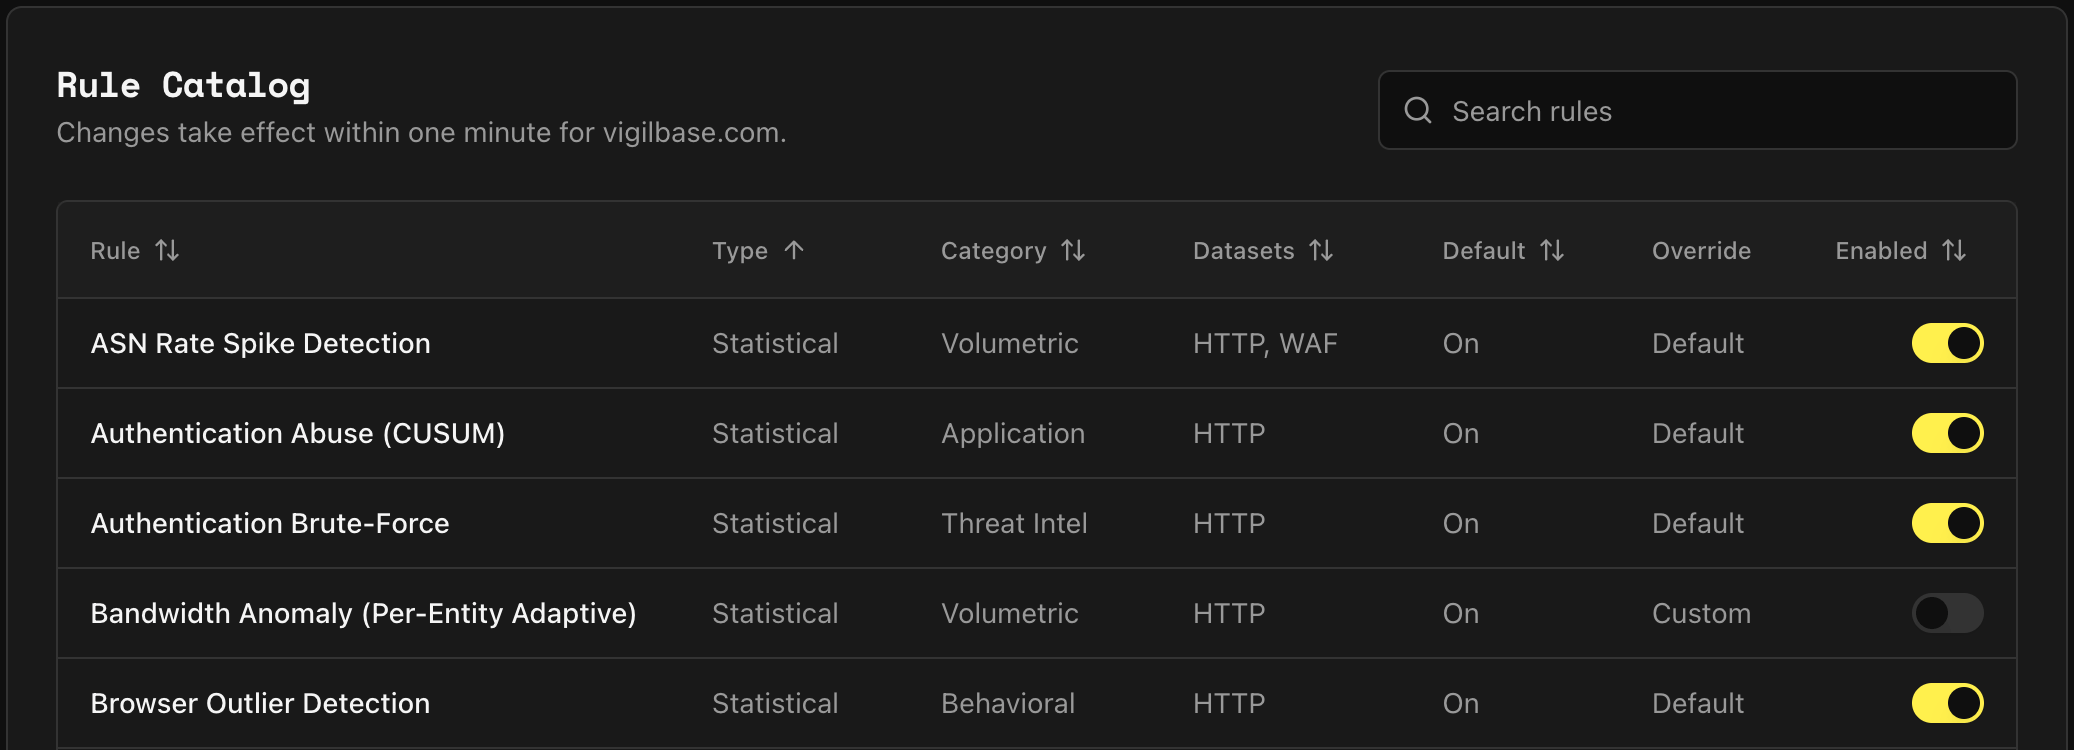
Per-asset detection management
- Manage detection rules on a per-asset basis from the new Detections page.
- Toggle individual rules per asset without affecting your other assets or global defaults.
- Only rules available on your current plan are shown.
Enriched IP intelligence
- IP lookups now include signals for residential proxies, VPNs, Tor, hosting providers, mobile networks, and more.
- New Connection Type and Anonymity columns on the alerts IP table.
- New filter groups on alerts: Country, Connection Type, Anonymity, and Network.
- AI triage explanations now incorporate these enriched signals.
Improvements
Logs page
- Filters consolidated into a single Filters popover with refinements, risk score filter, and field picker.
- Expanded log rows are more compact, with IP intelligence displayed inline.
- IP data loads automatically on row expand.
Cloudflare onboarding
- Connection wizard redesigned with searchable asset and dataset tables.
- Warnings shown before exceeding Cloudflare account log delivery limits.
- The Sync button now recovers and rebuilds missing log delivery jobs automatically.
Incidents
- New Threat Analysis panel displays AI triage results with clearer status messaging.
- Incident share links are more resilient.
- MITRE ATT&CK mapping and source IP actions added to the incident detail view.
- Attack-origin map now shown by default when geographic data is available.
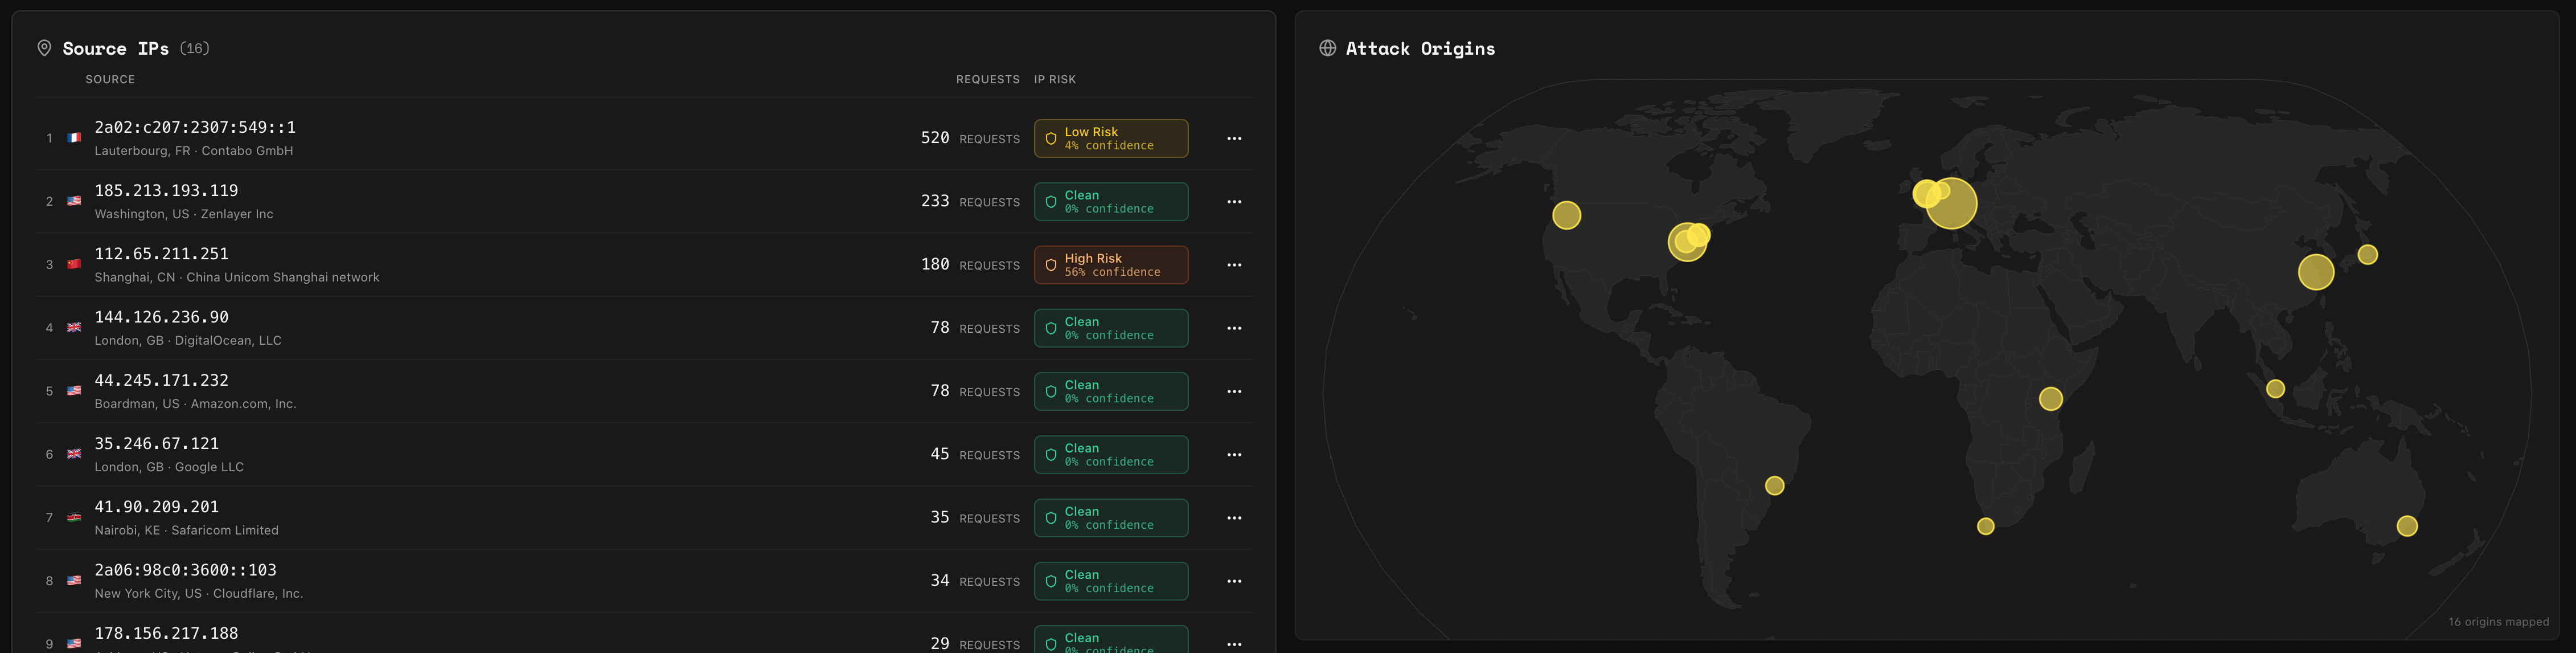
Notifications & sidebar
- Notification delivery counts are more reliable and scoped to your active organization.
- Sidebar stats update correctly when switching between organizations.
Vigil assistant
- Vigil can now retain context across investigations for more coherent follow-up analysis.
- Faster response times through improved caching of IP and enrichment data.
Landing page & pricing
- Refreshed pricing tiers and a new enterprise quote builder.
- New product comparison pages and integration index.
Fixes
- Share links now generate correctly in all environments.
- Threat Analysis panel no longer exposes internal error details on failure.
- User Agents card now shows user agent strings correctly.
- Risk score column shows “Warming up” instead of a zero score when not yet trained.
- Cloudflare connection wizard now clearly surfaces dataset errors instead of skipping past them.
- Notification and authentication flows are more resilient to transient connectivity issues.
- Cloudflare managed blocklist actions now include stricter validation before any changes are applied.
- More reliable AI analysis retries on incidents, with clearer handling of transient versus permanent failures.
- Weekly security report delivery is more reliable, with better separation between scheduled and on-demand reports.
- Incident investigations now include a new request-flow view for HTTP incidents, visualizing the path from source IP through user agent to the requested paths and affected asset.
- Dashboard usage metrics are more accurate, with better behavior when metrics data is temporarily unavailable.